1

Hedge Fund Leverage. Too much or too little?

Hedge Fund Leverage. Too much or too little?


Every time there is a hedge fund crisis the subject of leverage comes up. But how does one define leverage in a hedge fund? Is it the same definition you would use for a proprietary trading desk being allocated risk?


Let’s deal with fixed income and credit strategies separately as there are peculiarities which complicate. Let’s begin with the familiar equity long short strategy. Some managers measure leverage as total gross exposure as a percentage of NAV. That is, how many dollars long plus how many dollars short, divided by net assets. Another measure of risk, the directional risk of the portfolio, is the net exposure. This is the long exposure less the short exposure divided by net assets. Investors and managers tend to agree that the gross and net exposures are the accepted measures of static risk. Some managers use a ratio which is the long short ratio being the long exposure divided by the short exposure. It gives a sense of the directionality of the portfolio.


Gross and net exposures are useful metrics of leverage, but there are other interesting metrics. Consider the balance sheet of a fund.


Assets:

The assets of the fund include the equities held long, and cash whether the cash is from short sales, drawings on credit facilities or from the equity contributions.


Liabilities:

The liabilities of the fund include the equities borrowed for shorting, the mark to market P/L of the short positions, and any credit facilities for the purposes of leverage.


Shareholders Equity:

Shareholders equity is self explanatory.


Here is a snapshot of what a balance sheet would look like:

hfblcsheet1

This one shows 90% long and 90% short exposure, effectively a market neutral book with a gross of 180%.

The asset to equity ratio is picking up the 10 cash assets hence the discrepancy. Gross exposure is still a good measure as the cash assets exhibit no volatility.


From this position, consider mark to market P/L in the long and short books and the impact on the leverage ratios:


hfblcsheetsensitivity

Here Long MTM is positive if in profit and Short MTM is positive if in loss.

Observations are:

  • An unrealized loss on the long book increases leverage. Short exposure increases more quickly than long exposure decreases.  
  • An unrealized loss on the short book increases leverage. Short exposure increases more quickly than long exposure. 
  • An unrealized gain in the long book decreases leverage. Short exposure decreases more quickly with profit than long exposure increases.  
  • An unrealized gain in the short book decreases leverage. Short exposure decreases more quickly with profit than long exposure.

What this highlights is that losses and gains on the long book and or on the short book necessitate adjustments to both long and short books to arrive back at the desired level of leverage.


Risk, Volatility and Correlation:

Equity = E, L = Longs, S = Shorts and C = Cash.

E = L-S+C

Let’s assume that Cash has no volatility or correlation to the long and short books.

Thus the variances are V(E) = V(L) + V(S) – 2 Cov (L,S), for a fixed level of E.

Risk management of the NAV, what is important to investors, would have to take into account the volatility of the longs, the shorts and the correlation between the two sub portfolios. This is nothing extraordinary or novel and is how the industry already looks at risk. Not always is the risk decomposed this way and there are other decompositions of V(E). If the covariance between longs and shorts is low, the volatility of the NAV is a function of the sum of the volatilities of the assets and liabilities.


From the portfolio manager’s perspective, it is important to manage the liabilities of the fund as well. Liabilities will need to be managed to the Assets less the Equity of the fund. Thus the uncertainty or volatility of the liabilities must be a function of the volatility of the assets + the volatility of the equity less twice the covariance between assets and equity. Assuming that the correlation between assets and equity is zero, the variability of liabilities is an increasing function of the sum of the volatilities of Assets and Equity.


If the manager is targeting to create a long book and short book that is highly correlated so that one is a hedge for the other, then the variability of the liabilities is reduced. If the manager is creating highly independent long and short book, then the reduction in variability from the covariance term becomes negligible. Its just a point to note when a manager represents the style of management of the portfolio.

Central Banks and Moral Hazard

It is time for central banks to back away. Not from raising or cutting rates. It is time for them to extricate themselves from any activities that might distort market prices.

It is time for governments to back away. The economic purpose of government should be to provide frameworks and systemic infrastructure, and to only provide goods and services that the free market is unable to provide. Beyond that government should back away.

As long as regulators and policymakers maintain a safety net, there is no interest for the private individual to be prudent or diligent.

There is no interest to save for the future. No interest to invest for the future. No interest to assess the risk of an endeavor. No interest to live within one’s means. No responsibility for one’s own actions.

Without a safety net would we take out that mortgage we could not service on that house we could not afford, or buy that car or that watch?

Would we invest in the stock of that company we didn’t understand, that fund we didn’t do due diligence on, that structured product without reading the prospectus?

Ex Fed Chairman Greenspan’s statement that he would not act pre-emptively to deflate bubbles, since he could not recognize a bubble, but would instead step in to rescue a post bubble economy is nothing more than an explicit guarantee of state aid to the economy and asset prices. The asymmetry of such policy and the moral hazard it creates is remarkable. As remarkable is the market’s propensity to regard the policy as prudent.

The current situation is no different from the era of the Greenspan Put. While in 2008 it was necessary to intervene in the markets to maintain orderly function of the key infrastructure of finance, that time has long passed.

It is not beyond logical contemplation to ascribe the crisis to active central bank policy. While inflation fighting was a useful function some 2 decades ago, the signaling power of central bank policy overtook the real impact of policy. Expectations of effective policy in maintaining price and economic stability led to excessive risk taking and irresponsible financial planning by the private sector.

Ironically, the existence of a lender of last resort and a unilateral determinant of short term interest rates with a mandate for maintaining economic stability, while effective in the short run can be and has proven to be de-stabilizing in the long run.


Investment Strategy and Asset Allocation

In my earlier post of 8 October, I argued that if one had no memory and only asset allocated based on prevailing pricing, equities did not appear overvalued.

 I ignored assumptions of default risk in the bonds as well as recovery assumptions which may have tipped the scales in favour of credit over equities at the margin.

Now, let’s have a look at the picture if we did have a memory and looked at the evolution of the relative attractiveness between risky assets and government securities, and between equity and credit.


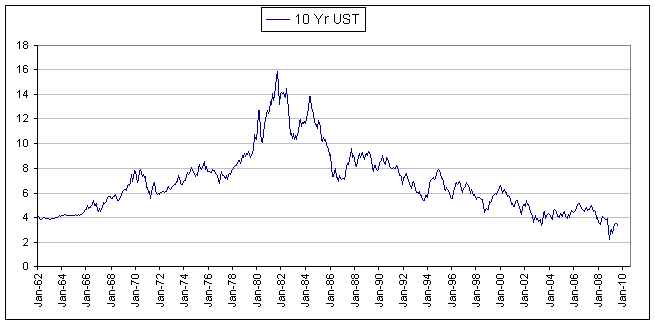
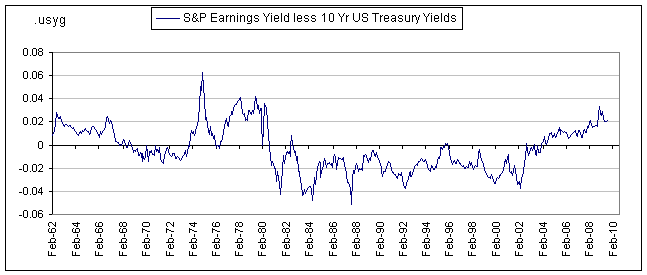
The yield gap between the S&P500 and 10 year US treasuries is as follows:

SPXYGust


On this measure, it certainly looks like equities are more attractive than government bonds. Add to this the fact that governments are transferring risk from private balance sheet to the public balance sheet in their various financial sector rescues, that fiscal policy is running extremely expansionary and will result in higher public sector borrowing requirements, and that the scale of the problem is global among developed countries and will see competition in issuance of government securities and the argument is quite compelling. You don’t want to own government securities.


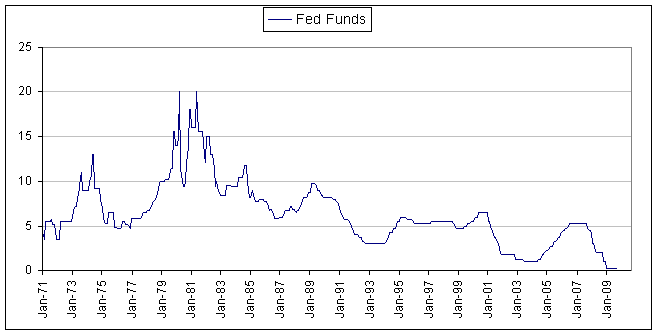
In part the bull market 2003 – 2007 was fuelled by the Fed holding rates too low resulting in the equity yield gap being too high and in fact rising through the period. Here, the Fed faces an interesting problem. As they raised rates from mid 2004 to mid 2006, the market takes it as an indication of a proactive policy likely to avert inflation and likely to promote financial stability, expectations that lead to continuing buying of Treasuries and yield products like corporate bonds. Also, ballooning USD reserves of China and Japan are recycled in effect in the form of an aggregate vendor financing from these net exporters, keep interest rates down in the US, fuelling further over valuation of yield assets.


Fed Funds rose 2004 – 2006


fdtr

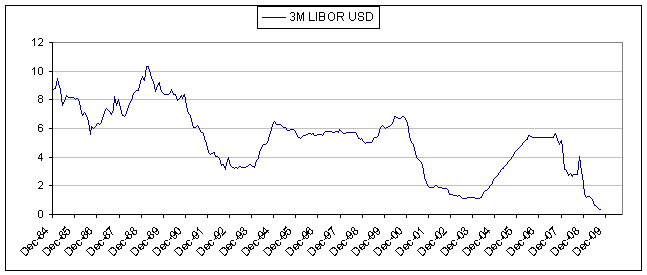
So did LIBOR, pulled by no-arbitrage pricing and proximity to Fed Funds:

us3mlibor

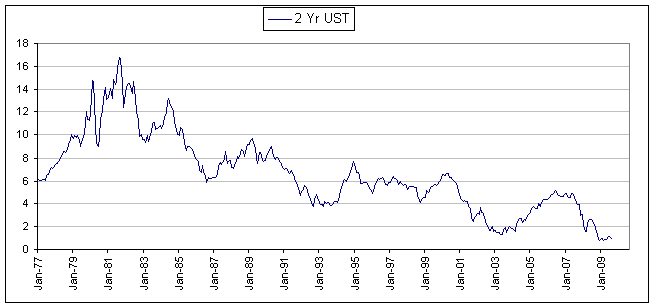
 But the impact at higher maturities is dampened by other effects:

 ust2

And is swamped by foreign purchases of longer dated US treasuries:

ust10


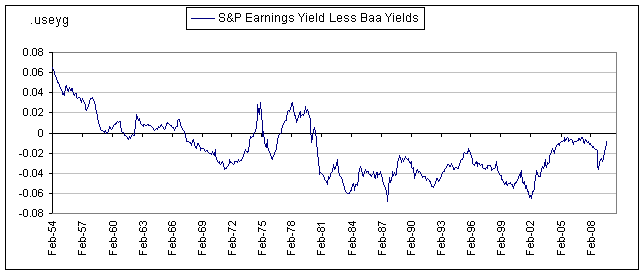
A similar comparison of S&P500 earnings yields against corporate bond yields obtains the following:

The yield gap between the S&P500 and 10 Baa corporate debt with average 10 year duration is as follows:

SPXYGBaa


At least cyclically, equities are cheap relative to corporate debt. Ordinarily one would adjust for default and recovery but government bailouts may have created and entrenched a moral hazard exacerbating the situation.

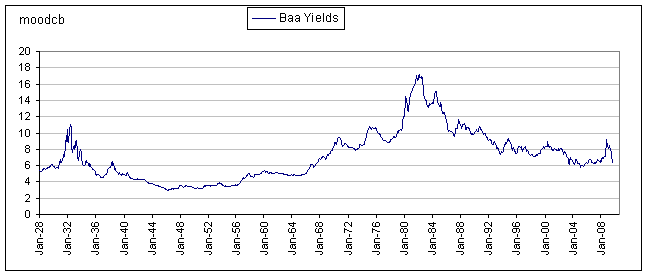
Now look at the period 2004 – 2006. The Fed had already begun to raise rates but look at the impact on corporate spreads. It is minimal. Yields do rise but not significantly.

Baa Yields, Avg Duration 10 years.

Baayields

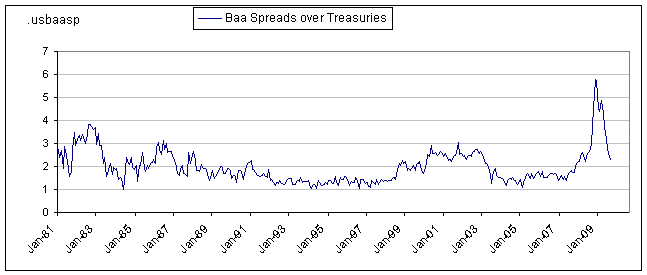
In fact Baa spreads over treasuries stayed low up until the 2008 credit crisis.

Baa Spreads, Avg Duration 10 years.

BaaSpread

Even so, the yield gap is rising from 2002 to 2007. The gap has recovered from a sharp dip in the 2008 crisis and today stands at levels which again recommend equities over corporate debt, at least relative to historical spreads. Looking at a snapshot of levels ignores equity volatility and credit default but looking historically does address some of these additional factors, albeit not by any means precisely.


GOLD!

I know nothing about gold so I will not say anything about it. You can’t eat it, you can’t burn it, you can’t make anything useful out of it. But, you can exchange it for other stuff. So let’s do that. I’m not interested in the value of gold since it means nothing to me, intrinsically. Let’s do look at other stuff measured in gold.

Money priced in Gold:

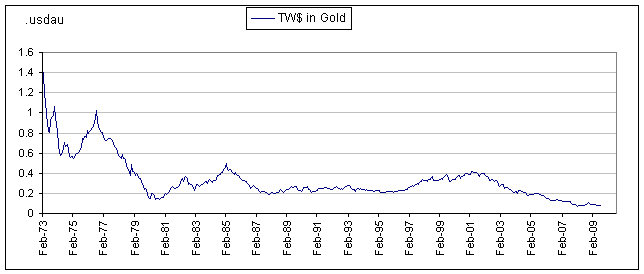
Here is a chart of the Trade Weighted USD priced in Gold:

TWDAU


The chart shows a debasement of the USD but a similar picture is true of GBP and EUR. JPY weakened in gold terms fro, 2005 to 2007 and has since stabilized and threatens to strengthen. As long as a government continues to print money and spend what it doesn’t have, one would expect its currency to fall in Gold terms. USE, GBP and EUR are clearly in this category.

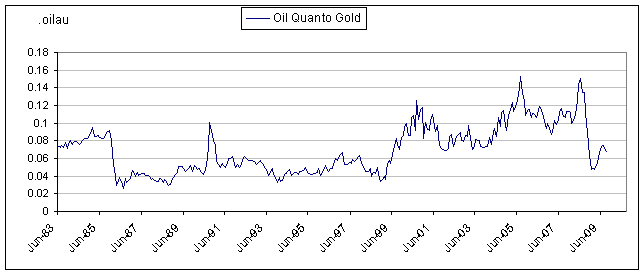
Oil priced in gold.

Brent quanto Gold:

oilquantogold

The oil price is almost perfectly priced. In a range 60 – 70 USD absolute, it is priced as marginal product in industrial production. Strategically, it is where Opec wants it, any lower and it hurts the fiscal condition of many Opec countries, any higher and alternative fuels become viable. In gold terms, we see a picture that tells us little. I used to think that the oil price moved into a higher range from 2000 onwards because of the accumulation of strategic reserves by the US in reaction to 9/11 and the Second Intifada. I haven’t changed my mind but I am looking for reasons to update a stale thesis. In the meantime, the global economy, particularly the inefficient users of energy in the emerging industrial economies seem to be in recovery which will likely support the price of oil, cyclically at least.

Equities priced in Gold:

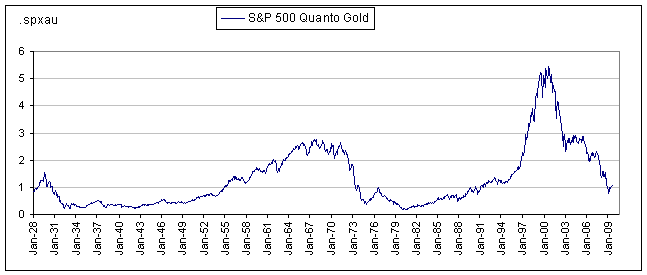
S&P500 Quanto Gold:

SPXquantoGold

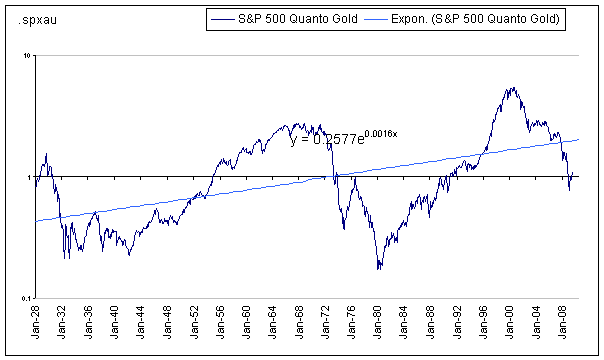
And again on a Log Scale

SPXquantoGoldlog

 So here is the question phrased and rephrased: Has the economy been set back 18 years in the last 1 year? Has 18 years of progress been wiped out? Of the 18 years of equity market value (quanto gold) that has been wiped out, how much was over valuation, bubble and fluff, and how much was real value? These are clearly loaded questions the obvious answers to which are, no, equity markets have been overly discounted and represent good value.  Unfortunately, there is a credible counterargument.

Can the S&P 500 go back to 650? Yes it can, and it would not look amiss on either a normal scale or a log scale. Is it likely to?

Driving corporate productivity and profits is human ingenuity. We would expect therefore that periods of decline are shorter than periods of progress. However, in gold terms, Nov 67 to Apr 80 was a protracted bear market, exacerbated if not precipitated by a USD crisis, the derailment from the Gold standard, an oil crisis and related inflation. In gold terms, we have been in an equity bear market since Sep 2000. The equity bears among us can therefore expect a potential further 4 to 5 years of bear markets in Gold terms. In Gold terms. Gold could also rise further. If quantitative easing and deficit spending continue, gold would likely rise further. Gold rises not so much because its fundamentals have improved as much as that the yardstick for measuring the value of gold, the USD or some such other fiat currency has been debased. As an inflation hedge, an industrial metal whose exposure can be directly or indirectly implied from the CPI basket would be a much more useful hedge. So too equities in the inflationary goods and services.

I will post a more detailed view on inflation but in the meantime, all I can say is that there is sufficient excess capacity in most economies that inflation is not a worry. This despite the effort of every government to debase their own currencies. There is a breaking point, however, at which confidence in a currency breaks which results in hyperinflation. Inflation is always and everywhere a confidence phenomenon.


Are Equities (and other risky assets) Overvalued?

Its the beginning of the 4th quarter and the 3rd quarter performance results and commentaries from the hedge fund managers are coming in thick and fast. A common thread runs through most of them. Risky assets are over-valued. Some say equities are overvalued, some say corporate bonds are overvalued. Who can tell? I decided to look at the state of the world in isolation of the past, with no memory of 2008, or the first half of 2009, with no memory at all.
 
Economists expect economic growth to be positive albeit low. In emerging markets the growth expectations are brighter, in developed markets poorer. Economists expect unemployment to rise or not improve. They expect industrial production to slow down from the current rebound from the inventory restocking. Inflation expectations are all over the place. On the one hand they expect monetary policy to be highly inflationary and on the other, excess capacity abounds in most industries.
 
Looking at S&P valuations, we find PE expectations of 18X for current year, 14X for 2010 and 11X for 2011. This equates to an earnings yield of 5.6%, 7.1% and 9.1% respectively. Earnings expectations continue to be upgraded from the overly pessimistic expectations of the earlier part of the year. Dividend yields, however, are close to 2.2 – 2.3 % p.a. over the 3 years. How realistic are these expectations? The current estimates are based on getting it wrong on the downside earlier in the year and adjusting the estimates upwards as realized numbers are reported. That said, profits are being driven by cost cutting rather than top line growth. The probability is significant that there will be a downturn in profits which will necessitate a revision of estimates to the downside.
 
Corporate bonds are yielding between 1% to 2% over treasuries depending on rating, (A to Baa). Call it 1.5% on average. Depending on your duration, this is either 1.8% over 1 year or 2.5% over 2 years or 4.8% over 10 years. 
 
3M USD LIBOR is at 0.28%, 1 year US T bill is yielding 0.33%, the 2 year 0.90% and the 10 year 3.26%. The yield curve is steep. The long end has sold off as risk has been transferred from private sector balance sheets to the public balance sheet. Policy makers are keeping short rates low and are likely to keep it lower for longer to spur economic growth.
 
Real estate valuations are stretched. Rental yields are low. Capital values are low but rentals are even lower. Moreover, real estate demand is highly dependent on the availability of credit, which is generally still scarce and especially so for real estate investments.
 
Commodities are highly cyclical and dependent on GDP growth. Demand for industrial commodities is expected to be robust in emerging markets and weaker in developed markets.
 
For the investor asset allocating to the various available markets, and investing with no memory, what are the choices? Also, we assume that the investor is not investing in alpha, hedged, arbitrage, relative value or long short strategies.
 
Equities appear cheap relative to credit and cash. Earnings yields of over 5% compare well with corporate bond yields of 2.5% to 4.8%. This is not adjusted for default and recovery assumptions. Compare equity dividend yields and the picture changes firmly in favour of credit. You get a higher cash flow yield and seniority of claim.
 
Compare equity dividend yields and corporate bond yields with cash and treasuries, however, and at least in the short term, risky assets are attractive.
 
Now add back recent memory. 2005 – 2007 saw a strong rally in risky assets.  At the end of 2007 one would have found risky assets attractive and probably buying the dips. This ended in a big bust in 2008 extending into early 2009. At the end of 2008, one would have been deathly fearful of risky assets. There is currently a healthy skepticism over the current market rally. It has not yet reached the stage where the majority is in love with risky assets. So, are expectations and sentiment merely noise?


Morgan Stanley Hedge Fund Forum

The Morgan Stanley Hedge Fund Forum 2009 was very interesting this year.

 Normally, this is held somewhere cool and luxurious where there are expensive and time consuming distractions like golf courses or beaches in case investors tire of talking to hedge fund managers or hedge fund managers tire of explaining themselves to investors. This year, Morgan Stanley decided to focus everyone’s attention and hold it in Rye, New York state. Its a lovely place, don’t get me wrong, with golf courses nearby, but is a place where the golfers are, well, golfers and not jaded hedgies trying to hide from one another. It is a lovely place. 

107 managers were presenting, I was told by the friendly Morgan Stanley conference team member. And over 500 investors. At the outset MS had expected and provided for 350 investors. The event had been oversubscribed. Initially the thinking was:

-its was a tough year last year for hedge funds. There was a risk that turnout would be poor.

-lets not be extravagant, let’s hold it somewhere modest, which from a public relations point of view was the right thing to do.

-lets hold it somewhere near where we live, in case nobody shows up, its a short drive home.

These were not my conclusions but what was half jokingly offered by way of explanation at the lunch speech

In any case: 

-the event became oversubscribed. MS initially closed at 350 investors but later relented and took in the full 500+.

-additional managers were added to the initial roster. Including one which was not a client of MS.

So, a successful if rather chaotic book build, an over subscribed offering, the overflow option completely exercised without cheapening the issue, and 100% demand satisfied. Morgan Stanley did it again and you could only call the event a success. The coaching that Morgan Stanley staff provided to managers in terms of the presentation, the pitch, the relevance and context to the investor type was very professional and effective. Here was a cap intro team earning their keep.

The managers presenting were higher quality, survivors of 2008, and the majority of which trading liquid strategies. 

An increasing number changed their liquidity terms to provide better liquidity, without mismatch, and there was some evidence of fee compression at least at the management fee level, as well. Performance fees remain sticky.

Many of the managers were established and of critical size by assets and were either previously closed and reopening to replace capital lost to redemptions last year, or had previously not marketed actively having never had to since capital went in search of them.

There were a handful of start ups, which is always refreshing and encouraging. I like start ups for the challenge they present of trying to assess quality without the luxury of a track record from which to naively extrapolate as so many investors do when faced with a fund with a 20 year track record, with 19 negative months and a volatility under 2% trading some complex split strike conversion thingamabob. New people with new ideas, often experienced, emerging from the shadows of their established brand name bosses. 

Then there are the investors. Bruised and battered from 2008 and the opening quarter of 2009 they were back in the hunt. In the first half of 2009 these capital introduction events were poorly attended and attended by investors more interested in what was for lunch than who they would meet. What a difference 6 months makes. What a difference a rising equity market makes, even to interest in absolute return and uncorrelated investment strategies. If investors are cynical about the claims of low correlation to traditional asset markets they need only look in the mirror. Back to the point: investor appetite. Funds were reporting small inflows and in some cases net inflows of capital. The line of questioning during the manager investor roundtables was more urgent and purposeful. 

I am and have been optimistic about the returns potential of hedge funds but had been long skeptical that investors would reallocate capital to the industry. I am officially changing my mind. I believe that the track record of hedge funds before, during and after the financial crisis of 2008 is proof of the pudding and that investors recognize that and will allocate once again.

What has changed? The amount of capital available has changed. The losses in traditional strategies has swamped the losses in hedge funds but still equates to less capital to allocate. The quality of hedge funds has improved simply by attrition – lower quality managers simply closed shop. Some high quality ones did too but we are talking about averages. The quality of investors has also improved. Lower quality investors also closed shop, on average. 

Investors should analyse the industry as much as the strategies and managers. What are the crowded strategies? Has the liquidity mismatch issue been addressed? Am I the investor creating the next adverse selection problem?

Managers too need to change their thinking. Is improving my liquidity terms simply setting myself up to be an ATM in the next crisis? Many of the funds that offered liquidity were writing cheques their portfolios could never encash. Why did they do it? To raise capital. Investors take note of what you are driving managers to do. Managers take note the quality of investors you are trying to woo.

If I ran hedge fund, I would manage the portfolio in an additional dimension: assets, liabilities and shareholder equity. When a manager of an operating company manages, they do so to a fixed and permanent equity base. They have to manage their assets and liabilities to that equity base. The liabilities are often fixed and the assets volatile and it is this volatility that is amplified through operational leverage and can erode partially or totally the equity of a firm. 

Fund managers should take the same approach managing a balance sheet. That the equity base is variable makes the job much much harder. One has a volatile asset portfolio (longs), a volatile liability portfolio (shorts, short term credit lines,) and variable equity (investors who can subscribe or redeem.) 
Managers need to choose their investors as carefully as they choose their longs, shorts, prime brokers, and derivative counterparties.

Its been a good conference with much food for thought. Thanks and kudos to Morgan Stanley for hosting and arranging a useful and interesting forum.